


Community design
 Healthy community design means planning and designing communities to make it easier for people to live healthy lives.
The design and layout of Utah's cities and neighborhoods influence the health of people who live in them. For example, it is difficult to be physically active if sidewalks and parks are not available and accessible. Eating a healthy diet is hard if healthy food choices are not available in your community. Urban sprawl, inadequate public transportation, and energy inefficient buildings not only affect human health but also have a distinct impact on climate change through the generation of greenhouse gas emissions. Healthy community design:
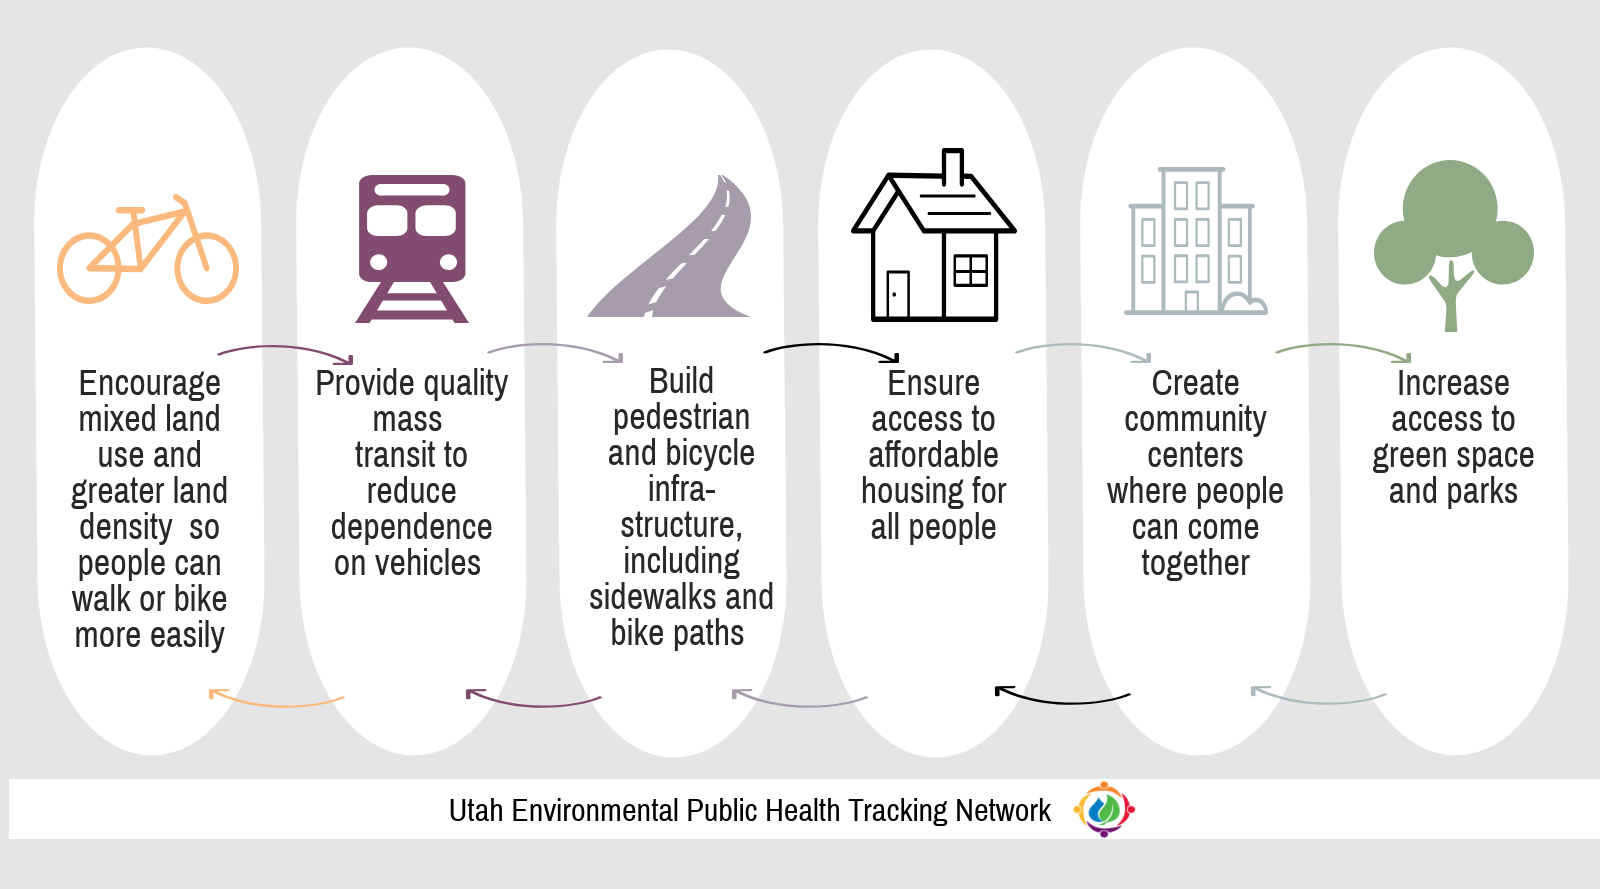
- Encourages mixed land use and greater land density so people can walk or bike more easily.
- Provides quality mass transit to reduce dependence on personal vehicles.
- Builds pedestrian and bicycle infrastructure including sidewalks and bike paths.
- Ensures access to affordable housing for all people.
- Creates community centers where people can come together.
- Increases access to green spaces and parks.
Poor community design elements are related to some of the leading causes of death and disability in the US such as injuries, heart disease, diabetes, obesity, and asthma.
Where you live matters to your health. Healthy community design provides the following benefits:
Where you live matters to your health. Healthy community design provides the following benefits:
- Promotes physical activity, thereby reducing adult and childhood obesity
- Improves air quality by lowering air pollution.
- Lowers risk of injuries.
- Reduces traffic injuries.
- Increases social connection and sense of community.
- Reduces contributions to climate change.
Communities designed with health in mind have many features in common. Those main features are:
Check out the Explore Community Design data tab for Utah-specific community design data.
Our visualizations include greenhouse gases, access to parks and elementary schools, commute time, types of transportation to work, and proximity of population and schools to highways.
Healthy community design includes a variety of principles:
- Accessible, reliable public transit options, like buses or trains
- Safe, well-maintained sidewalks and bike paths
- A variety of grocery stores, especially those that stock fresh produce and culturally appropriate foods.
- Safe, affordable housing
- Safe parks and public spaces
Check out the Explore Community Design data tab for Utah-specific community design data.
Our visualizations include greenhouse gases, access to parks and elementary schools, commute time, types of transportation to work, and proximity of population and schools to highways.
Healthy community design includes a variety of principles:
Community design is one of several social determinants of health.
Access to healthcare, economic stability and income, neighborhood and physical environment, education, food access, and community and social context are intimately connected to health. These are collectively known as the social determinants of health.
Here's an example of how social determinants impact health: residents of less educated and lower income ZIP codes are more likely to have heart disease, cancer, and a lower life expectancy than those of ZIP codes with higher levels of education and income.
 Designing healthier places to live is a collaborative effort between architects, city planners, government officials, and community members.
Whether it's transportation, healthy food, safe housing, or public spaces that promote health, community design is all about access to essentials for quality of life. As a member of your community you can promote health through community design:
- Attend community meetings where decisions are made about how land will be used, especially around public transit, sidewalks and bike paths, access to fresh, healthy foods, and parks and public spaces.
- Talk with elected officials.
- Work for policy change.
Resources
- EnviroAtlas home page- EnviroAtlas is a tool provided by the U.S. Environmental Protection Agency. EnviroAtlas provides interactive resources to explore the benefits people receive from nature, or "ecosystem goods and services." It uses 7 broad categories to organize its information and data: clean air; clean and plentiful water; natural hazard mitigation; climate stabilization; recreation, culture, and aesthetics; food, fuel, and materials; and biodiversity conservation.
- EJSCREEN Tool- EJSCREEN is a mapping tool provided by the U.S. Environmental Protection Agency. It combines environmental and demographic information about environmental justice topics.
- Centers for Disease Control and Prevention (CDC)- Healthy Community Design
- Centers for Disease Control and Prevention (CDC)- Planning and Health Resource Guide for Designing and Building Healthy Neighborhoods
- Utah Geological Survey- Energy and Mineral Resources
- U.S. Energy Information Administration-Greenhouse Gas Information
- Centers for Disease Control and Prevention (CDC)- Community design
Greenhouse gases
Access to parks and elementary schools
- Children aged 5 to 9 years living within a half mile of a public elementary school (count) by county, Utah, 2010
- People living within a half mile of a park (count) by county, Utah, 2015
- Children aged 5 to 9 years living within a half mile of a public elementary school (percentage) by county, Utah, 2010
- People living within a half mile of a park (percentage) by county, Utah, 2015
Commute time
- Average one-way (minutes for workers 16 years and older for all travel modes) by year
- Average one-way (minutes for workers 16 years and older for all travel modes) by county
- Number of workers 16 years and older driving 20+ minutes to work by year
- Number of workers 16 years and older taking public transportation 45+ minutes to work by year
- Number of workers 16 years and older taking public transportation 45+ minutes to work by county
- Number of workers 16 years and older walking 10+ minutes to work by year
- Number of workers 16 years and older walking 10+ minutes to work by county
- Percentage of workers 16 years and older driving 20+ minutes to work by year
- Percentage of workers 16 years and older driving 20+ minutes to work by county
- Percentage of workers 16 years and older taking public transportation 45+ minutes to work by year
- Percentage of workers 16 years and older taking public transportation 45+ minutes to work by county
- Percentage of workers 16 years and older walking 10+ minutes to work by year
- Percentage of workers 16 years and older walking 10+ minutes to work by county
Types of transportation to work
- Number of workers 16 years and older by year
- Number of workers 16 years and older by county
- Percentage of workers 16 years and older by type of transportation and year
- Percentage of workers 16 years and older that used active transportation by county, Utah
- Percentage of workers 16 years and older that used car, truck, or van by county, Utah
- Percentage of workers 16 years and older that worked at home by county, Utah
- Percentage of workers 16 years and older that used public transportation by county
Proximity of population and schools to highways
No related public data queries.
Click here to view all available public queries and metadata for all secure portal queries.
Click here to view all available public queries and metadata for all secure portal queries.
Utah Tracking collects greenhouse gas data from the greenhouse gas inventories from the Utah Geological Survey. Remaining community design data were obtained using the National Environmental Public Health Tracking Network application program interface (API).
View complete metadata for:
View complete metadata for:
